Everyone who lives in Malta knows that the island changes shape over the year. The supermarket queue in August is not the supermarket queue in December, and the same seafront can feel like two different towns. On 15 October 2026 the National Statistics Office put numbers on that feeling, locality by locality.
Its news release Tourism Intensity: 2025 (NR 182/2026) estimates how many tourists are present on an average day, adds them to the resident population, and shows where the pressure concentrates. The headline: in August 2025, St Julian's had 143 tourists for every 100 residents. Valletta was close to one tourist per resident. Other districts barely registered.
For anyone choosing a place to live, or deciding whether to stay where they are, it is a rare official measure of crowding at town level.
What the NSO measures
The release uses three ideas.
Tourist population is the number of tourists present per day in a given period, calculated from nights spent in all forms of tourist accommodation, rented and non-rented. That includes people staying with friends and family, not only hotel guests.
Effective population is the resident mid-year population plus that tourist population. It answers a simple question: how many people are actually on the island, or in a town, on an average day?
Tourism intensity is the number of tourist nights per 100 residents per day. An intensity of 15 means 15 tourists for every 100 residents.
Two methodological points matter for reading the figures. First, the NSO corrects for Maltese residents travelling abroad at the same time, subtracting outbound tourist nights from inbound ones. This is why one district can show a negative figure. Second, each tourist is assigned to the locality of longest stay: someone who spends eight nights in St Julian's and two in Valletta counts fully for St Julian's. Day trips to Valletta or Mdina from a hotel elsewhere therefore do not show up in those towns. The release counts sleepers, not day visitors.
The national picture
In 2025 Malta's usually resident mid-year population was 581,244. On an average day, tourism added 50,767 people, bringing the effective population to 632,011. Annual tourism intensity rose to 8.7, from 8.2 in 2024: roughly nine tourists for every 100 residents, one more than the year before.
The seasonal swing is large:
- August, the peak month: 90,332 tourists per day, an effective population of 671,576 and an intensity of 15.5.
- December, the low month: 13,184 tourists per day, an effective population of 594,428 and an intensity of 2.3.
The gap between the two is 77,148 people, or 13.0%, on the same resident base. One detail stands out in the monthly table: July 2025 had fewer tourists per day than July 2024 (64,298 against 68,455, down 6.1%), while August rose 11.9% to its new peak. February and March, by contrast, grew by 30.0% and 24.1%. The shoulder season is filling up faster than the summer.
For residents, the effect on density is concrete. Malta had 1,845 residents per square kilometre in 2025. Counting the average tourist population, the figure becomes 2,006 persons per square kilometre, and in August 2,132. The population density debate usually uses the first number; the people on the pavement are the second.
The districts: a north-east story
The NSO splits Malta into six districts. Their 2025 tourism intensity:
- Northern (which includes St Paul's Bay and Mellieħa): 15.3
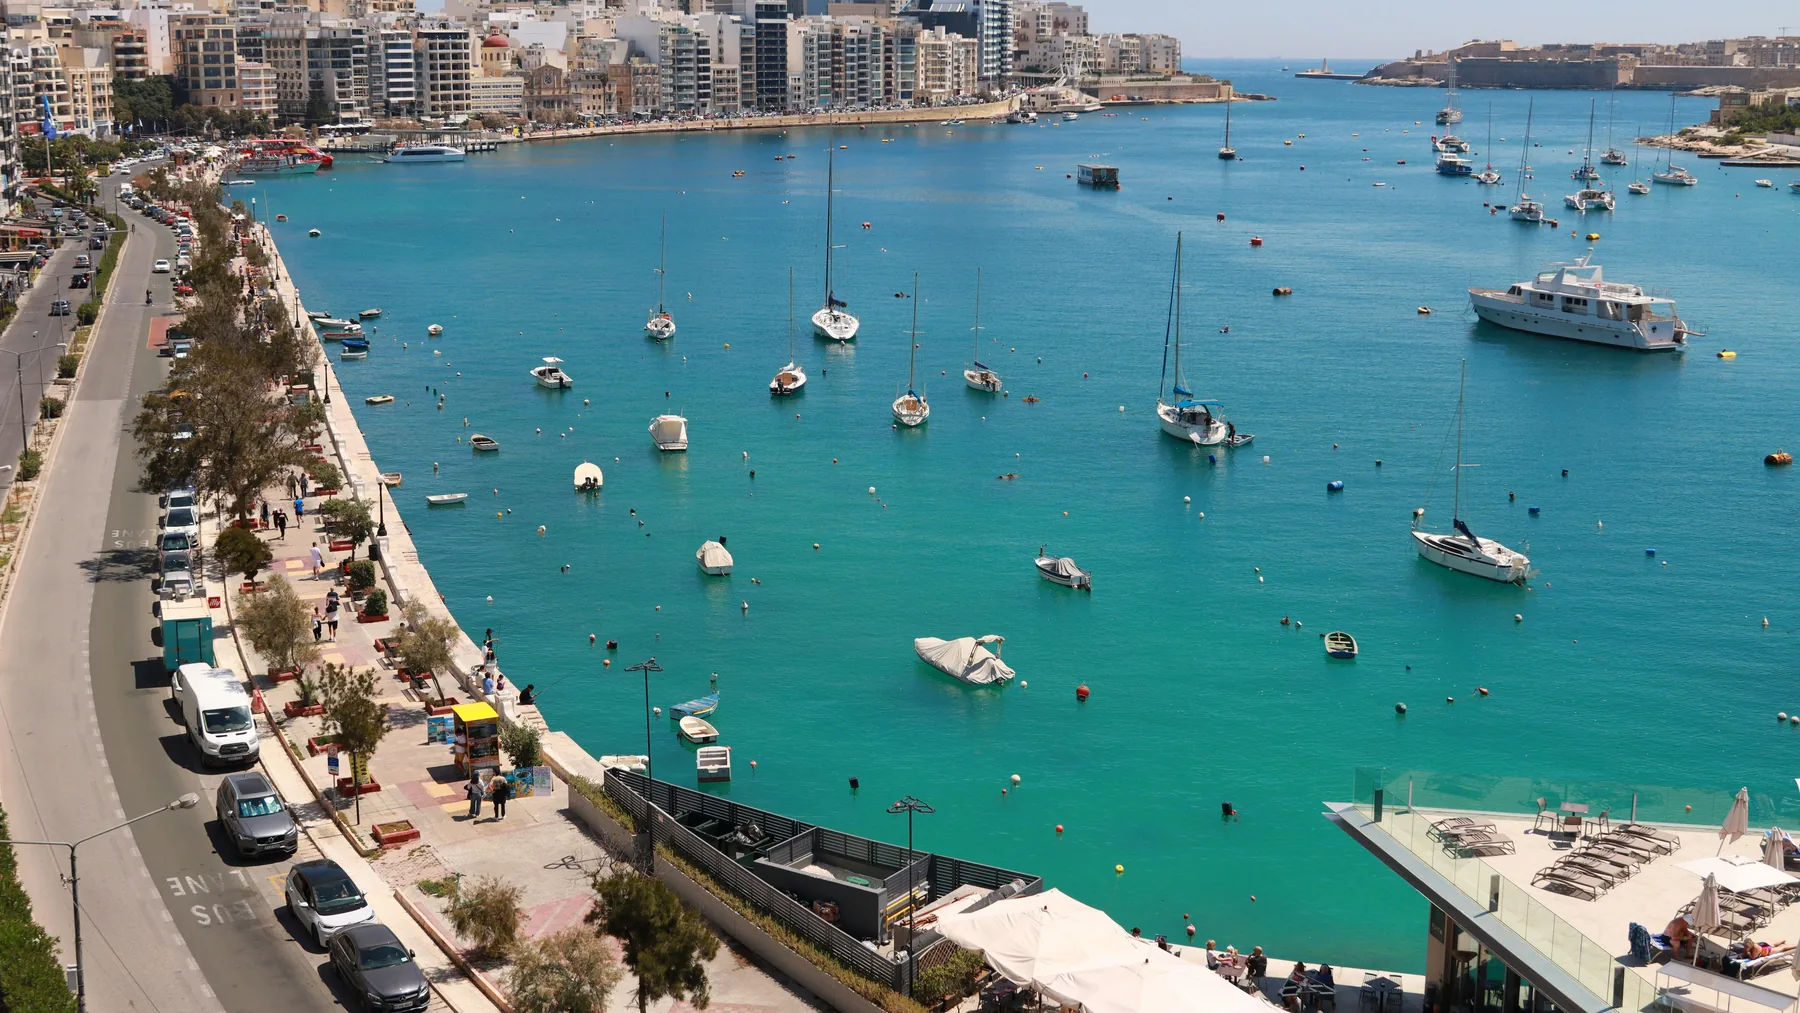
- Northern Harbour (which includes Sliema, St Julian's and Gżira): 14.6
- Southern Harbour (which includes Valletta): 5.9
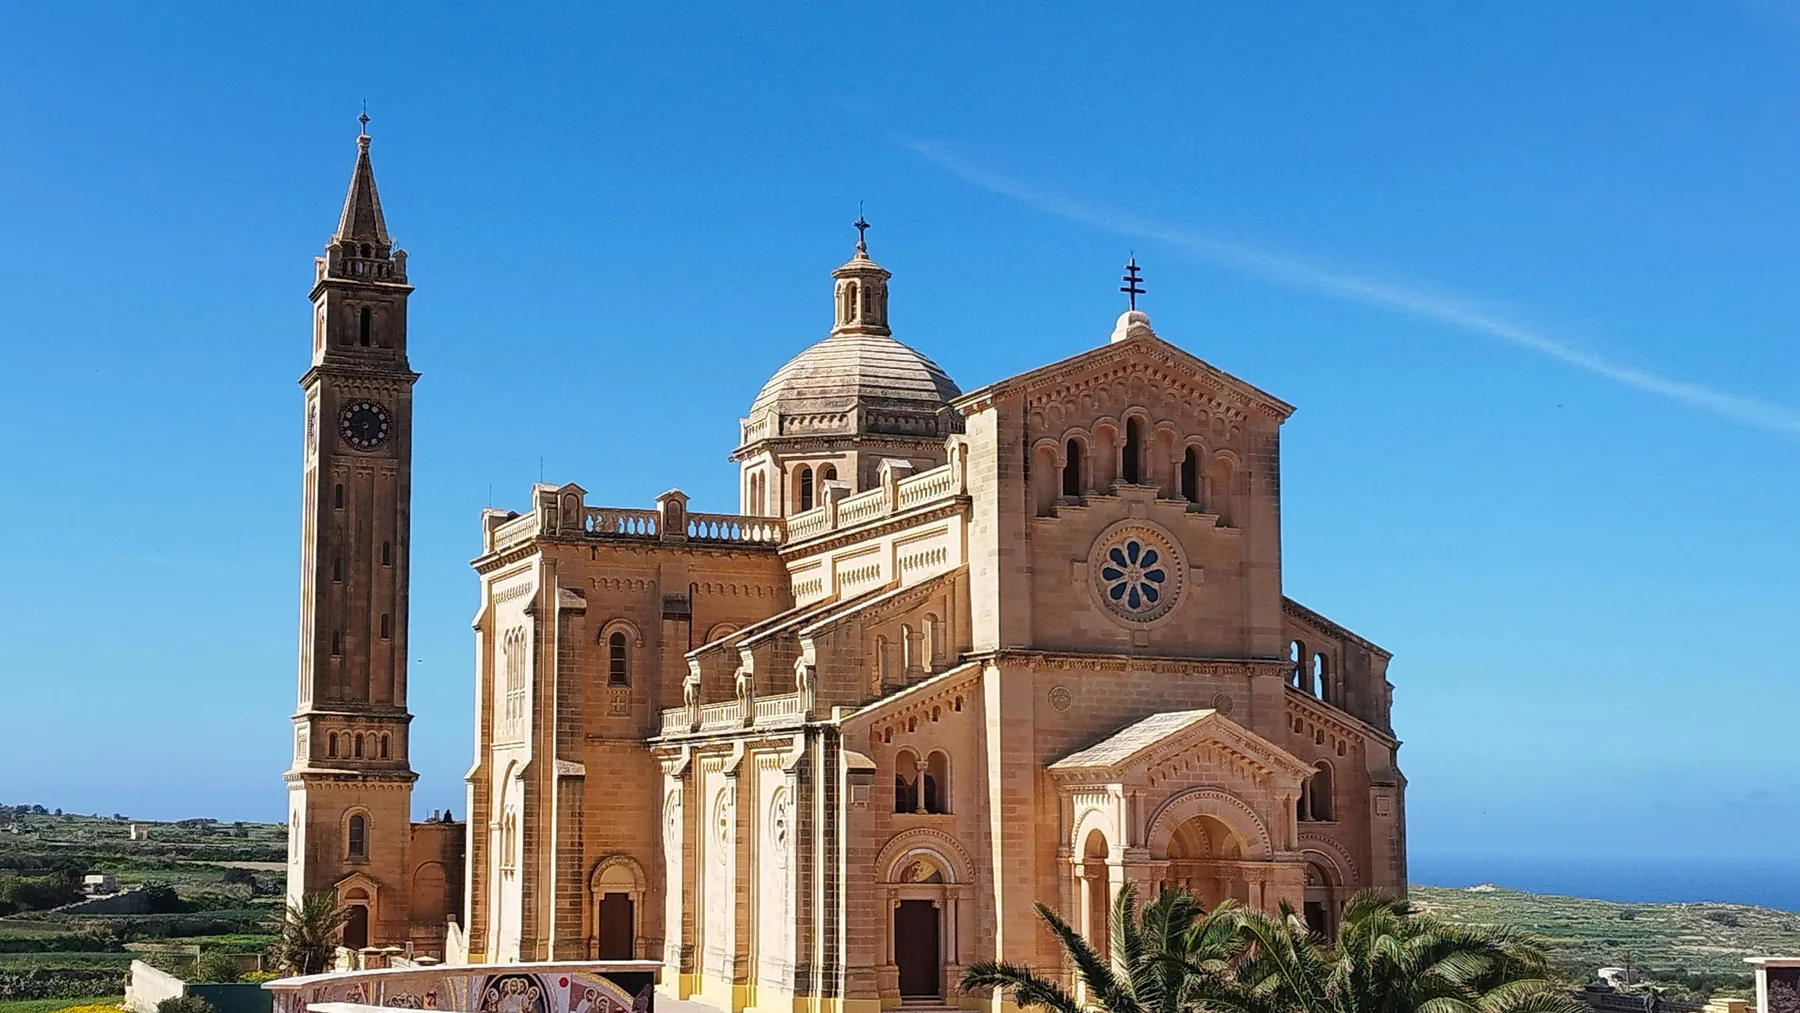
- Gozo and Comino: 4.0
- South Eastern: 0.5
- Western: minus 0.9
The negative Western figure is the outbound correction at work: more residents of that district were away abroad on an average day than tourists stayed there. The South Eastern district is close to zero for the same reason.
The Northern Harbour district has the largest tourist population, 27,073 a day on average, and the largest effective population. Its resident density of 7,718 per square kilometre rises to 8,845 once tourists are counted, an extra 1,127 people on every square kilometre.
The direction of travel differs too. The tourist population of the Southern Harbour district grew by 18.8% in 2025, the fastest of any district. Gozo and Comino went the other way, with 10.9% fewer tourists per day than in 2024, and an intensity that fell from 4.6 to 4.0.
The six busiest localities
The release gives detailed figures for the six localities with the most tourism. Here is the annual intensity for 2025, with 2024 in brackets:
- St Julian's (San Ġiljan): 82.9 (79.9)
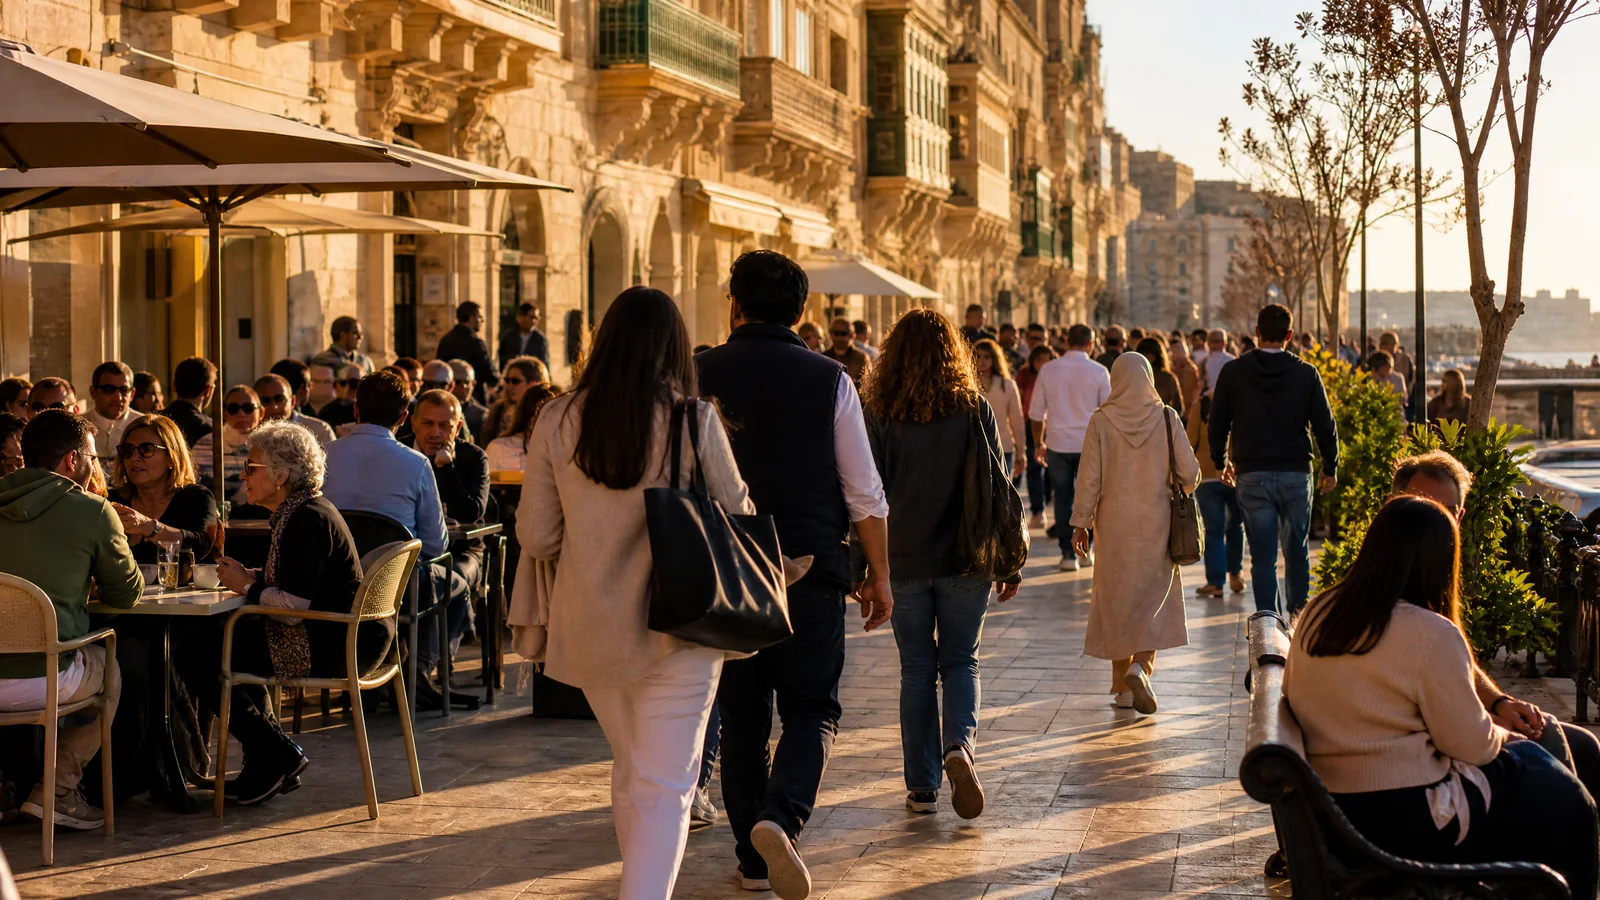
- Valletta: 80.5 (69.9)
- Sliema (Tas-Sliema): 42.7 (39.8)
- Mellieħa: 40.1 (37.2)
- Gżira: 30.2 (21.8)
- St Paul's Bay (San Pawl il-Baħar): 27.8 (27.7)
Valletta had the largest increase of all, with almost 11 more tourists per 100 residents than a year earlier. Gżira rose by 8.4 points, driven by a 37.8% jump in its average tourist population, from 2,688 to 3,704 a day, while its resident population edged down. St Paul's Bay was flat in intensity, but not in people: its residents grew by 4.4% to 40,536 and its tourists by 4.8%, so both sides of the ratio rose together. St Julian's also added residents, up 4.8% to 15,420, alongside 8.8% more tourists.
August
In the peak month the picture sharpens:
- St Julian's: 143.0 tourists per 100 residents, up 16.5 on August 2024. On an average August day the town held about 37,464 people against a resident population of 15,420.
- Valletta: 98.5, up 16.4. The capital's 5,239 residents shared it with about 5,159 overnight tourists.
- Mellieħa: 66.7.
- Sliema: 63.9, with an effective population of 37,614.
- St Paul's Bay: 46.6, down 3.9 on 2024. In absolute numbers it was still the largest, with an effective population of 59,444.
- Gżira: 37.6.
December
The low month shows which places stay busy all year. Valletta remained the most tourist-heavy locality in December at 55.9, more than half its August level. St Julian's fell to 36.2, Sliema to 35.0, Gżira to 24.6, Mellieħa to 21.0 and St Paul's Bay to 10.8.
That is the difference between a town that empties after summer and one that does not. Mellieħa's intensity in December is less than a third of its August figure, and St Paul's Bay's less than a quarter. Valletta's tourism is far more even.
Density
The density figures are where crowding becomes physical. Sliema had 17,703 residents per square kilometre in 2025, already the densest of the six. Counting the average tourist population it reached 25,268, and in August 29,023 persons per square kilometre. St Julian's saw the largest August jump, an extra 13,702 people per square kilometre on top of its residents, reaching 23,286.
At the other end, Mellieħa and St Paul's Bay cover much larger areas. Even in August, Mellieħa's effective density was 1,078 per square kilometre and St Paul's Bay's 4,107. The tourists are numerous there, but they spread out.
What the figures mean when choosing where to live
The NSO makes no judgement about quality of life, and a single statistic cannot settle that question. But read together with rents, commutes and personal priorities, the release answers several practical questions.
If you want a seafront life with year-round activity, Sliema and St Julian's deliver it, and the figures show the price: in August Sliema's population on an average day grows by almost two thirds, and St Julian's more than doubles, with tourists outnumbering residents. The where-to-live guide covers the trade-offs between these towns in more depth.
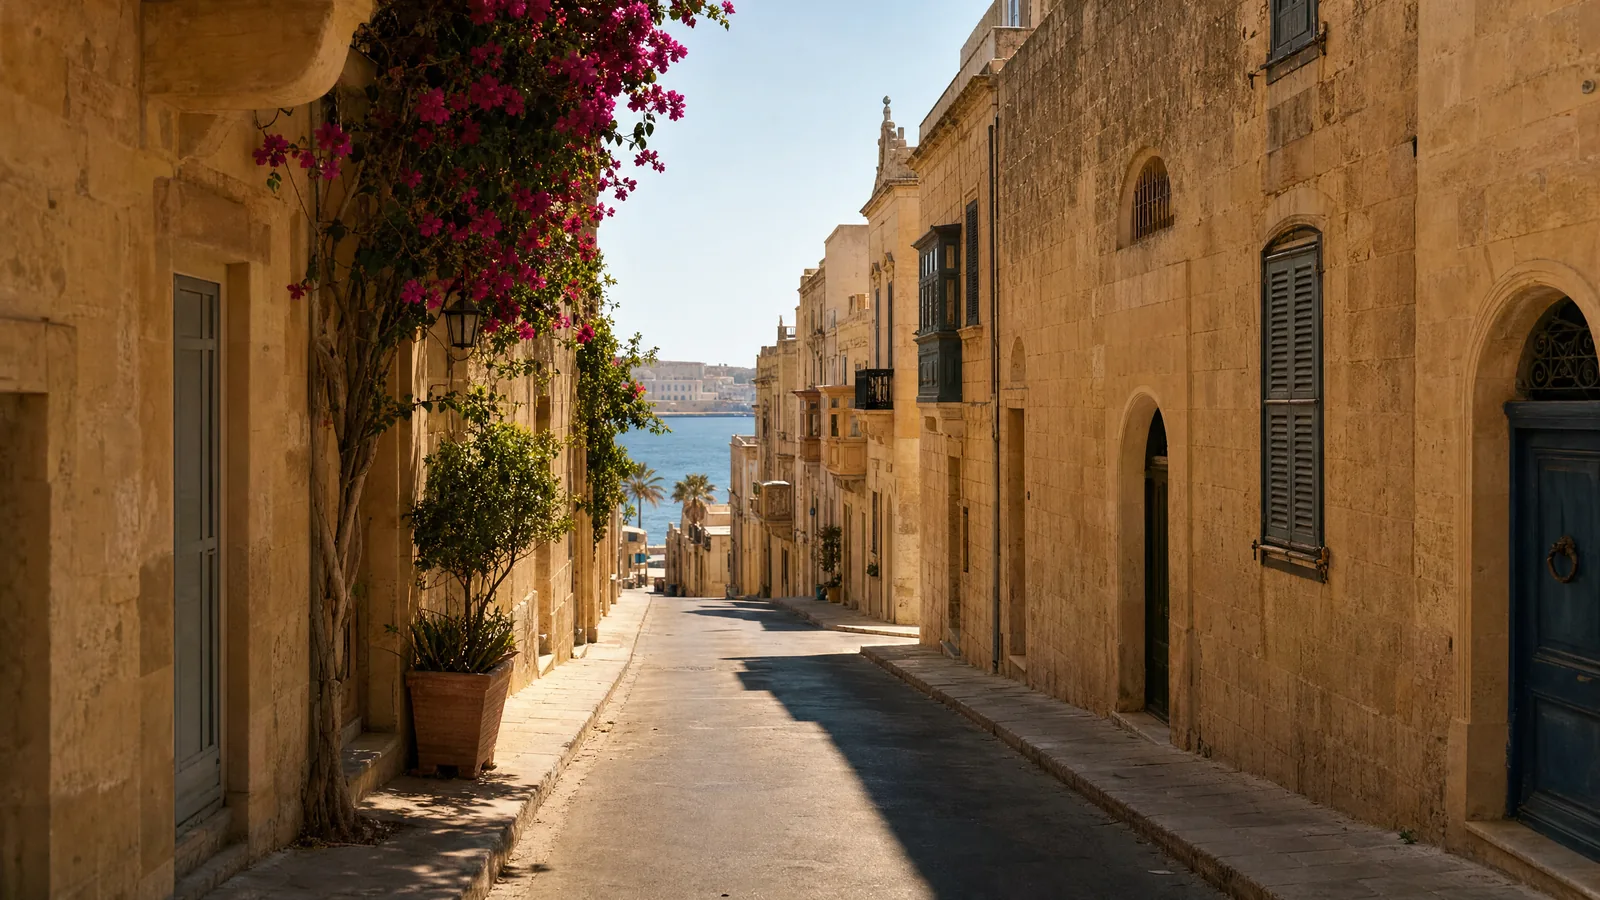
If you are drawn to Valletta, expect tourism to be part of daily life in every month, not only in summer. With 80.5 tourists per 100 residents on an annual average and the largest increase of any locality in 2025, the capital is becoming more tourist-heavy, not less.
If you want summer quiet, the north is not automatically the answer. Mellieħa and St Paul's Bay have high August intensity, but because they cover large areas their density stays far lower than in the harbour towns, and December brings a sharp drop.
If you want the least tourism, the South Eastern and Western districts show intensities close to zero or below it, and Gozo's tourism fell in 2025. The NSO publishes locality figures only for the top six, so the release cannot tell you about a specific village in those districts.
If you plan your year around the season, the release supports what long-term residents already do: August is the month of maximum pressure, and it coincides with the heat, discussed in our summer heat guide. Shoulder months are growing fastest, so the quiet window is narrowing at both ends.
Open space matters more where density is highest. The north-east coast gained a protected area in July, when White Rocks became a national park, in Pembroke, inside the most populous district. For a slower pace across the channel, see our profile of Gozo.
Limits of the data
A few cautions before reading too much into the figures:
- Day visitors are not counted. People who visit a town without sleeping there, including day-trippers from other localities, add to crowds without appearing in that town's figures.
- Locality of longest stay. Multi-town stays are assigned entirely to one locality, and stays with no main locality are dropped from local breakdowns, so district totals do not add up exactly to the national figure.
- Revisions. The NSO revised its 2023 and 2024 figures in this release after methodological updates to the National Tourism Survey. Comparisons should use the 2025 release, not earlier ones.
- Resident base held constant. Effective population uses the mid-year resident estimate for every month, so it does not capture residents' own seasonal movements beyond the outbound correction.
Even with those limits, the release is a clear official measure of where Malta's tourists sleep and how that changes over a year. For a resident, it turns a vague impression into numbers that can be compared town by town.
Work with Sebastian
If you are choosing where in Malta to live and want the practical, legal and tax side planned together, book a consultation.